Know which buildings an earthquake reaches first.
Seismic screening for council and public buildings. Map your facilities once, then see where shaking would land and how hard — for a published Australian scenario, for any earthquake you place yourself, and against the live national feed. Built on Australia’s own hazard models and building-code eras. Your data is stored in Sydney.
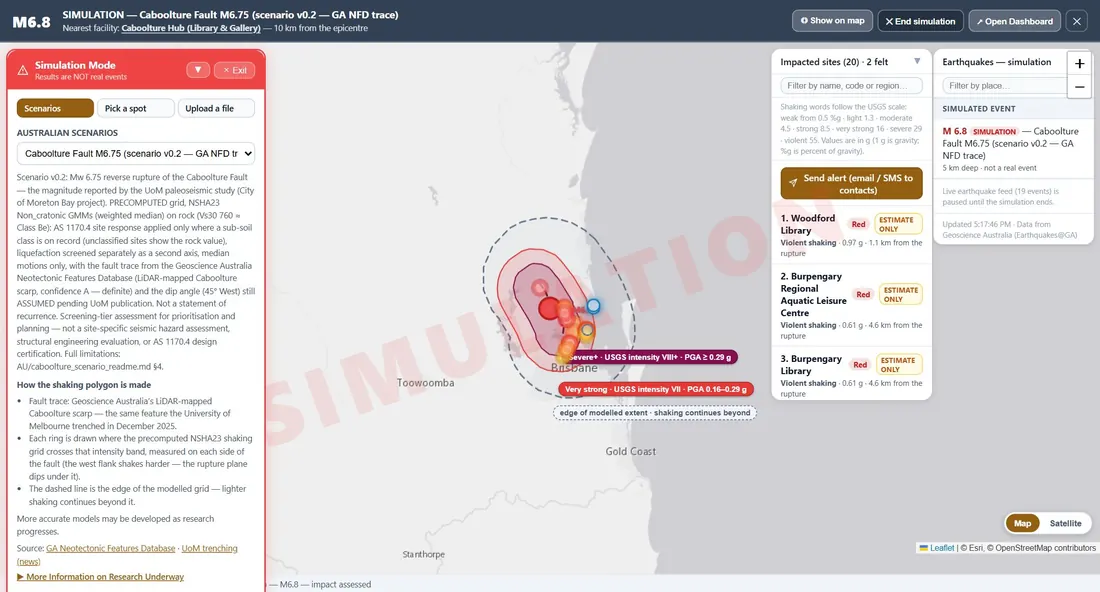
The Caboolture Fault M6.75 scenario over public council buildings in South East Queensland. A simulation, not a real event.
From a list of buildings to a triage order.
The same three steps whether you are planning ahead or an earthquake has just been felt.
Map your facilities
Place each building by name or on the map. Record what you know — when it was built, what it is built from, the ground under it. Anything not yet known says so, and still maps.
Run an earthquake
Use the published Caboolture Fault scenario, or place your own: choose a magnitude, depth and fault type anywhere in eastern Australia, or move a real past earthquake into your area.
Triage and report
Every building gets a shaking value and a colour, worst first. Print facility cards and snapshots, put the list on the EOC wall, and send a prepared alert to your contacts.
Built for Australian conditions.
What the Australian edition does — and, plainly, what it doesn’t yet.
Shaking at each building
Ground motion from the 2023 National Seismic Hazard Assessment models, computed with openquake and loaded as data — no formula is improvised in the app.
Australian code eras
Each building’s likely design level comes from when it was built, read against the Australian earthquake-loading standard’s history (before 1980, 1980–93, 1994–2007, 2008 on).
Ground that makes it worse
AS 1170.4 site response where the sub-soil class is known, and liquefaction screened as a separate second check from the Queensland geological map.
Damage colours Estimate only
No Australian-calibrated damage curves are published yet, so the colours use widely used US curves read through Australian code eras. Every result says so, and no damage percentage is shown.
Live earthquake feed
Earthquakes from Geoscience Australia on the map as they happen, with the nearest of your buildings. From magnitude 4.5 in eastern Australia, each building gets a calculated shaking value from the same national model as the scenarios — labelled as calculated, never as a measurement.
Severe wind Coming
FacilityStorm — wind regions, design wind speeds and forecast gusts against the same building register — is being added to the Australian edition.
Australian data, named and cited.
Every number in the app traces to a published source. Where a value is still being verified, the app marks it pending.
- National Seismic Hazard Assessment 2023 — Geoscience Australia Ground-motion models, computed with openquake for the Caboolture scenario and the What if… table.
- Neotectonic Features Database — Geoscience Australia (CC BY 4.0) Mapped fault traces, including the LiDAR-mapped Caboolture scarp, with their confidence shown.
- Earthquakes@GA — Geoscience Australia The live national earthquake feed.
- Surface geology 1:100 000 — Geological Survey of Queensland (CC BY 4.0) Suggests each site’s liquefaction susceptibility class.
- AS 1170.4 — Standards Australia Site sub-soil classes and the code-era boundaries. Edition still being verified, and marked pending in the app.
Your register stays in Australia.
Your organisation’s buildings, contacts and results are stored in Sydney, separately from every other country’s customers. Access is by invitation only, and you can sign in with your organisation’s Microsoft work account.
Screening-tier assessment for prioritisation and planning. Not a site-specific seismic hazard assessment, structural engineering evaluation, or AS 1170.4 design certification.
Licensed to your council.
An upfront licence for your organisation and its buildings, then hosting and support. Tell us about your portfolio and we’ll set up a trial with your own facilities.